

Food Dehydrator Dry Matter Testing
Vortex Hairdryer Dry Matter Testing
Karen Jacobsen Bovine Veterinarian
Global Dairy Consultants & Volunteers
Nicaragua Dairy Feed Analysis, 2011
|
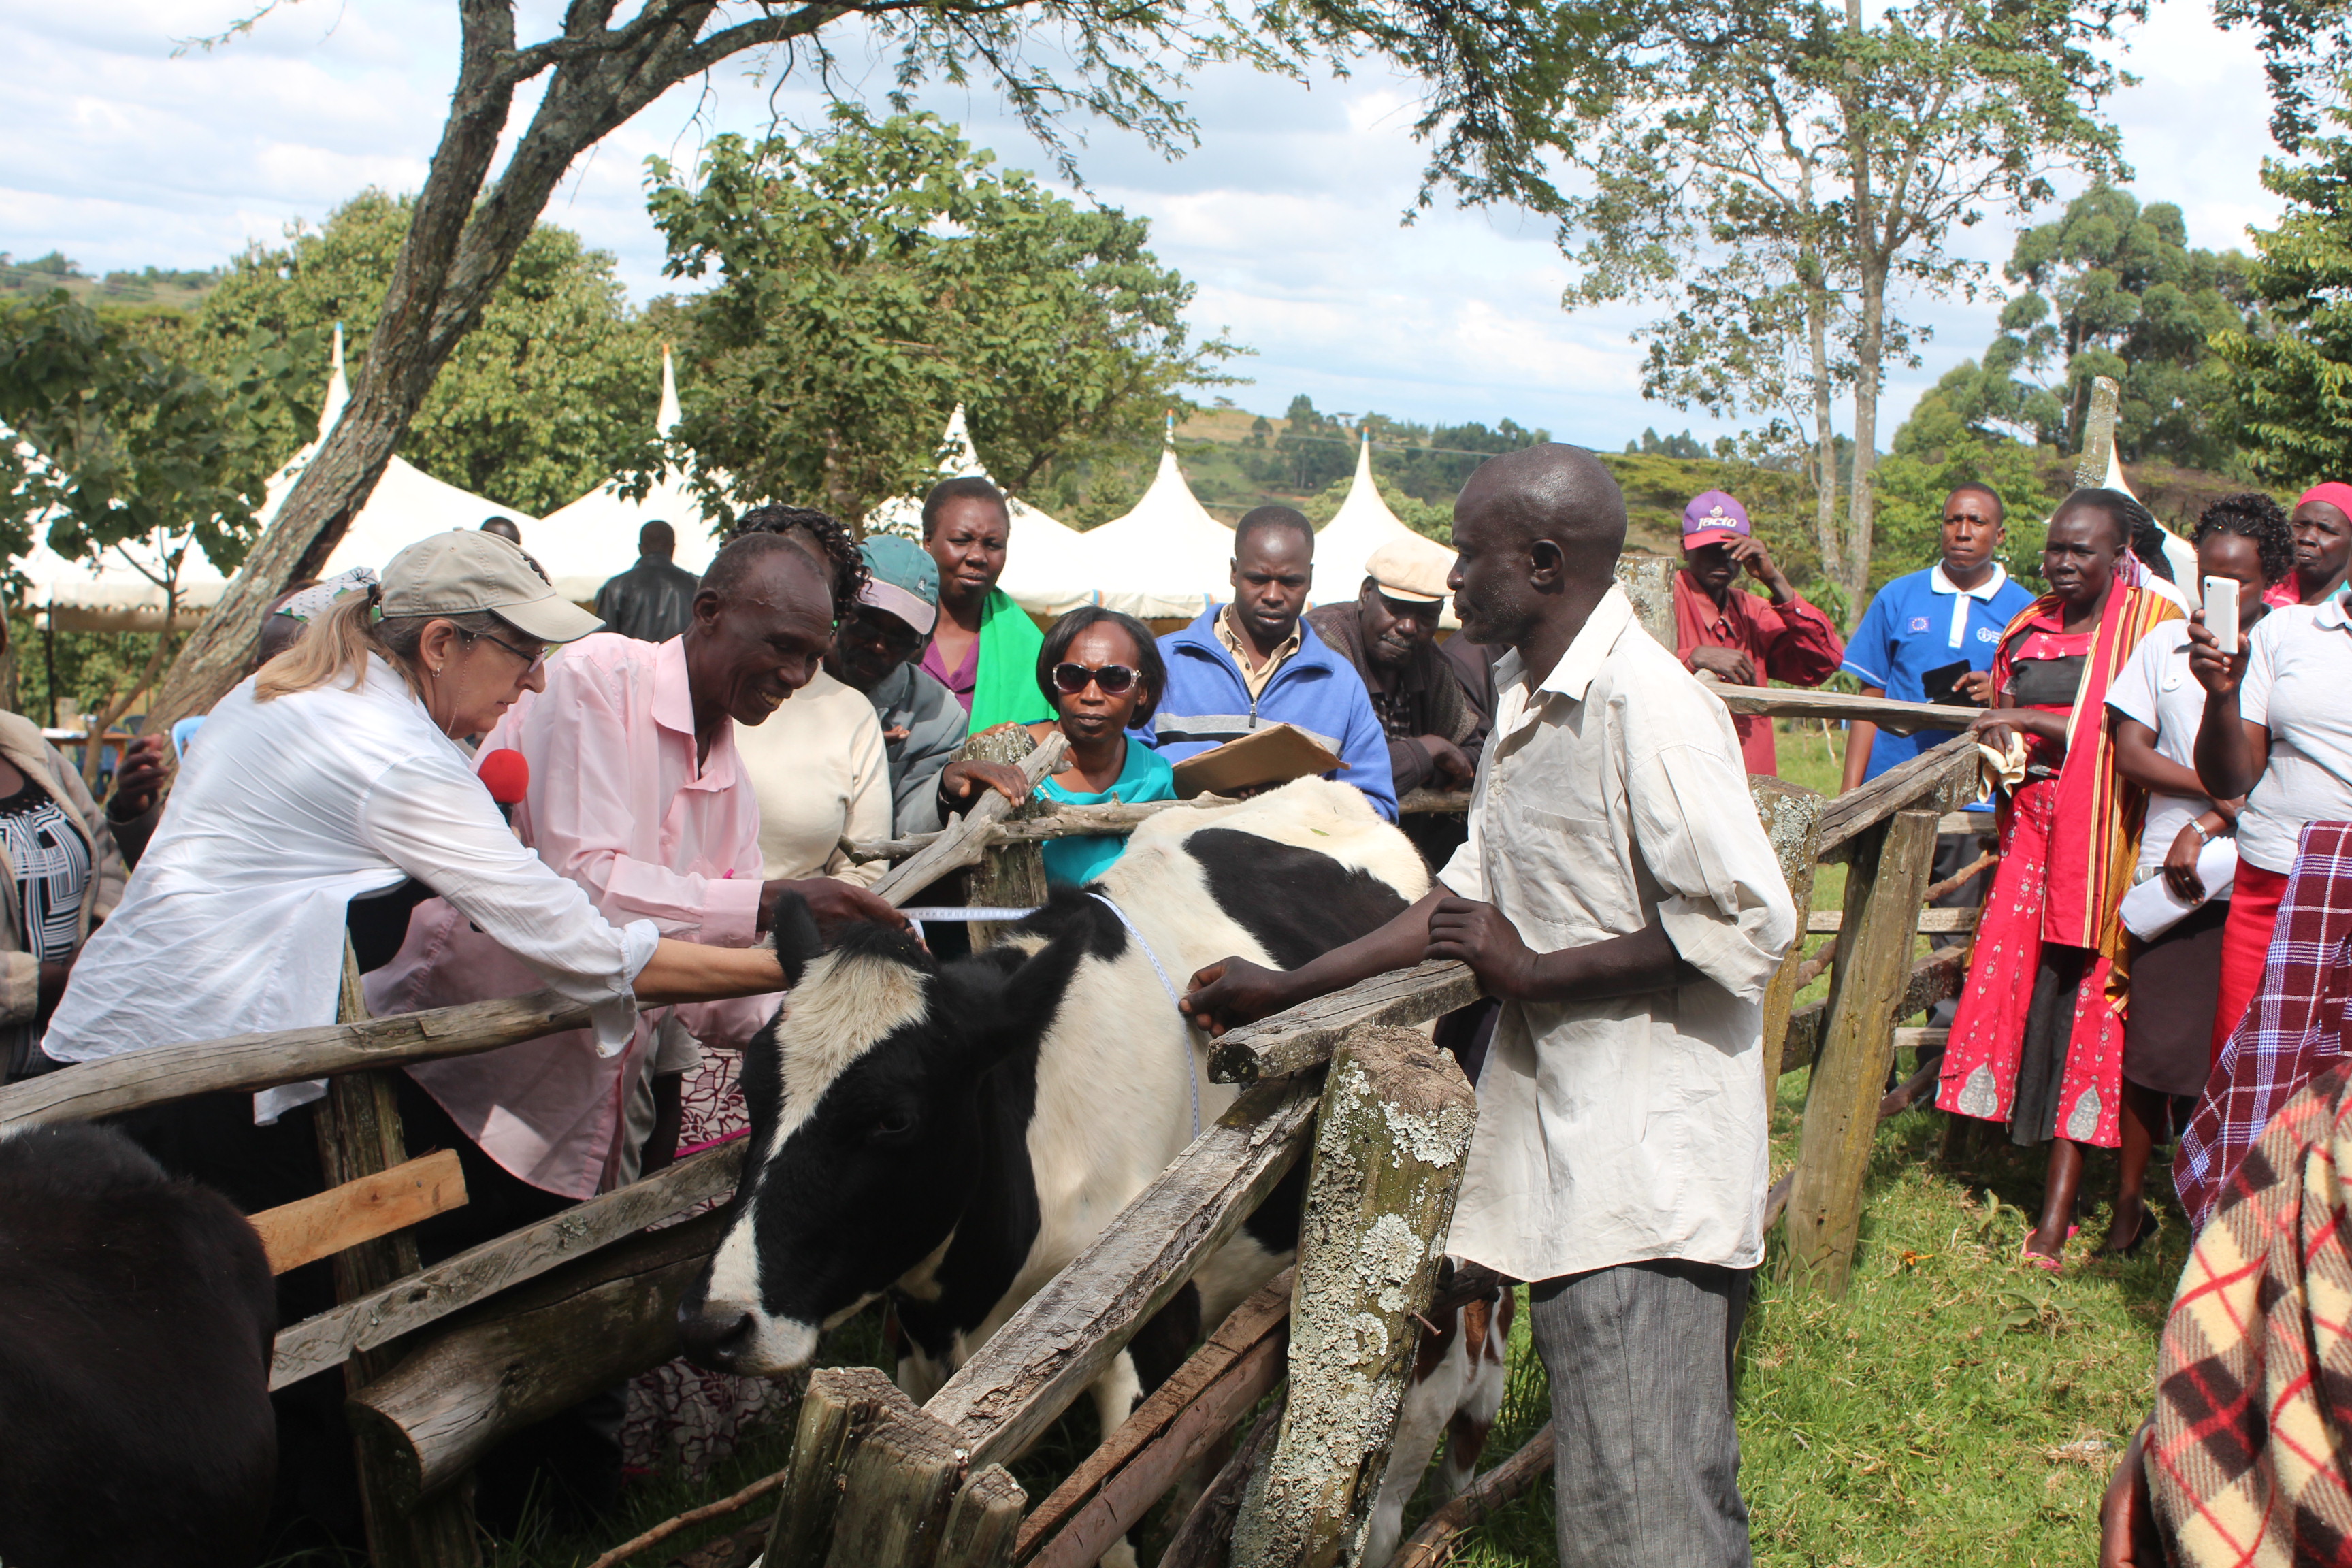
Dr Jacobsen travelled to Nandi County in Western Kenya in November & December, 2016, with Catholic Relief Services & the USAID Farmer-to-Farmer program. Scroll down for the training: PRACTICAL BASIC DAIRY RATION FORMULATION BY HAND. In the photo below, Dr Karen Jacobsen is demonstrating how to weigh-tape dairy cows in Nandi County in Western Kenya, December, 2016. |
|||||||||||||||||||||||||||||||||||||||||||||||||||||||||||||||||||||||||||||||||||||||||||||||||||||||||||||||||||||||||||||||||||||||||||||||||||||||||||||||||||||||||||||||||||||||||||||||||||||||||||||||||||||||||||||||||||||||||||||||||||||||||||||||||||||||||||||||||||||||||||||||||||||||||||||||||||||||||||||||||||||||||||||||||||||||||||||||||||||||||||||||||||||||||||||||||||||||||||||||||||||||||||||||||||||||||||||||||||||||||||||||||||||||||||||||||||||||||||||||||||||||||||||||||||||||||||||||||||||||||||||||||||||||||||||||||||||||||||||||||||||||||||||||||||||||||||||||||||||||||||||||||||||||||||||||||||||||||||||||||||||||||||||||||||||||||||||||||||||||||||||||||||||||||||||||||||||||||||||||||||||||||||||||||||||||||||||||||||||||||||||||||||||||||||||||||||||||||||||||||||||||||||||||||||||||||||||||||||||||||||||||||||||||||||||||||||||||||||||||||||||||||||||||||||||||||||||||||||||||||||||||||||||||||||||||||||||||||||||||||||||||||||||||||||||||||||||||||||||||
 |
|
||||||||||||||||||||||||||||||||||||||||||||||||||||||||||||||||||||||||||||||||||||||||||||||||||||||||||||||||||||||||||||||||||||||||||||||||||||||||||||||||||||||||||||||||||||||||||||||||||||||||||||||||||||||||||||||||||||||||||||||||||||||||||||||||||||||||||||||||||||||||||||||||||||||||||||||||||||||||||||||||||||||||||||||||||||||||||||||||||||||||||||||||||||||||||||||||||||||||||||||||||||||||||||||||||||||||||||||||||||||||||||||||||||||||||||||||||||||||||||||||||||||||||||||||||||||||||||||||||||||||||||||||||||||||||||||||||||||||||||||||||||||||||||||||||||||||||||||||||||||||||||||||||||||||||||||||||||||||||||||||||||||||||||||||||||||||||||||||||||||||||||||||||||||||||||||||||||||||||||||||||||||||||||||||||||||||||||||||||||||||||||||||||||||||||||||||||||||||||||||||||||||||||||||||||||||||||||||||||||||||||||||||||||||||||||||||||||||||||||||||||||||||||||||||||||||||||||||||||||||||||||||||||||||||||||||||||||||||||||||||||||||||||||||||||||||||||||||||||||||
|
PRACTICAL BASIC DAIRY RATION FORMULATION BY HAND PRACTICAL BASIC DAIRY RATION FORMULATION BY HAND (Instruction Handout used for Western Kenya, 2016) Karen L Jacobsen, BS, DVM, MS www.KarenJacobsen.net, 706-340-0999 USA cellular, email: KLJVET@gmail.com Example: A Friesian cow with a Chest Girth of 187 cm weighs about 500 kg. Use BCS scale of 1-5: BCS 1 = Extremely Thin BCS 2 = Thin BCS 3 = Normal BCS 4 = Fat. BCS 5 = Extremely Fat See the Normal Lactation Curve (See "Tables for Hand Rations" on Left Sidebar of this website). BCS Normal values: Calving: BCS 3.0 – 3.5 Peak Lactation: BCS 2.5 – 3.0 (maximum loss of 0.5 BCS) Dry-Off: 3.0- 3.5 NOTE: The cow must not be thin at calving. Since she cannot consume enough Dry Matter to reach Peak Lactation, she must use energy from her backfat. Thus, loss of 0.5 BCS is normal, but if the cow is thin at calving, she will become emaciated at peak lactation. Rule of Thumb: 1 L/ 10 kg body weight + 1.5 L/kg milk Example: 450 kg cow, producing 20 kg milk 45 L + 30L = 75 L water needed/day NOTE: Drinking water needs increase dramatically as ambient temperature increases. Rule of Thumb: Dry cows & growing heifers: 2.0– 2.5% of body weight in kg Lactating cows: 3.0% to 4.0% of body weight in kg. Higher intakes are needed for higher production. Example: 450 kg (990 lb) cow, producing 20 kg (44 lb) of 4.0% fat milk needs 17 kg DM (from Table 2). (The table is recommending 3.78% of the 450 kg cow’s body weight.) 161 Mj ME 1826 g CP 75 g Ca++ 59 g Phos Ideally, all feeds should be analyzed at least monthly, but in the absence of this information, values from tables can be used for an estimation. (Be aware that actual values can vary greatly from table values.) Example: The feed available are: Example: 161 Mj ME/7.9 Mj ME/kg DM = 20.38 kg DM is needed to provide enough Energy. (It cannot be the sole feed because maximum DMI is 17 kg.) NOTE: Be sure the cow receives adequate “Effective” Fiber (consider quality of forage, “scratch factor,” rumen fiber mat, “tossed salad” appearance of final feed). Example: 8.5 kg forage DM (Napier grass) x 7.9 Mj ME/kg DM = 67.15 Mj ME 8.5 kg concentrate DM (Dairy Meal) x 9.1 Mj/kg DM = 77.35 Mj ME Total = 144.50 Mj ME Thus, energy is still deficient for maximal milk production for this cow. Try replacing some of the Dairy Meal with a higher energy byproduct, Cassava Peels (Table 6). With this “Trial & Error” method, it easiest to make a table: DMI ME(Mj) CP(g) Ca P DMI ME(Mj) CP(g) Ca P Napier 8.5 67.15 833 30.6 24.65 8.5 67.15 833 30.1 24.65 Dairy Meal 8.5 77.35 1326 51.0 38.25 5.5 50.05 858 CassavaPeels 0 0 0 0 0 3.0 34.50 156 Total 17.0 144.50 2159 81.6 62.90 17.0 151.70 1847 Requirement 17.0 161.00 1826 75.0 59.00 17.0 161.00 1826 Shortage 0 -16.5 333 6.6 3.90 0 -10.70 21 Rule of Thumb: Divide the desired kg of needed DM by the % DM of the feed, expressed as a decimal. Example: Napier Grass: 20%DM 8.5 kg/.20 = 42.5 kg As Fed Dairy Meal: 90%DM 5.5 kg/.90 = 6.1 kg As Fed Cassava Peels: 87% DM 3.0 kg/.87 = 3.4 kg As Fed TOTALS: 17.0 kg DM 52.0 kg As Fed ------------------------------------------------------------------------------------------------------------------------------------------ Table 1. Estimating Dairy Cow & Heifer Weight by Chest Girth Dr. Karen L. Jacobsen, www.FARMLLC.org, USA cell: 706-340-0999 Chest Friesian Guernsey Jersey Chest Friesian Guernsey Jersey Girth Weight Weight Weight Girth Weight Weight Weight cm kg kg kg cm kg kg kg 69 37 31 26 191 526 503 487 71 38 33 28 193 544 517 497 74 40 35 31 196 566 531 504 76 41 37 35 198 582 544 510 79 44 41 39 201 601 558 514 81 47 45 44 203 620 84 52 50 49 206 639 86 57 56 55 208 657 89 62 62 61 211 676 91 68 68 68 213 693 94 74 74 74 216 709 97 81 81 81 218 726 99 88 88 88 221 742 102 95 95 94 224 758 104 102 102 101 226 772 107 110 109 108 229 787 109 118 117 115 231 802 112 126 125 122 234 816 114 135 132 129 117 143 141 136 119 152 149 144 122 161 157 153 124 171 166 161 127 180 175 171 130 190 184 180 132 200 193 189 135 210 203 198 137 220 213 208 140 230 224 218 142 241 235 229 145 253 247 239 147 264 259 251 150 277 271 264 152 289 283 277 155 302 296 289 157 316 310 303 160 329 323 317 163 344 338 331 165 358 352 346 168 372 367 360 170 389 382 375 173 405 398 390 175 421 414 406 178 438 429 420 180 455 444 435 183 472 459 449 185 489 474 463 188 508 489 475 Table 2. Daily nutrient requirements for a dairy cow by cow weight and milk production Cow weight (kg) Milk Yield 4% fat (liters) Dry Matter Intake (DMI) (kg) ME Energy (Mjoules) Crude Protein (g) Calcium (g) Phosphorus (g) 250 0 6 35.5 246 10 7 5 7 60 682 23 23 10 8 88 395 38 32 300 0 7 40.5 270 12 8 5 8 66 742 25 25 10 9 90 1029 40 34 15 11 116 1316 55 42 350 0 9 45.5 294 14 10 5 10 72 806 27 27 10 11 97 1093 42 36 15 12 123 1380 57 45 20 13 152 1667 72 54 400 0 10 50.3 318 16 11 5 11 78 874 29 29 10 12 103 1161 44 39 15 13 129 1448 58 48 20 14 156 1735 73 57 450 0 11 54.9 341 18 13 5 12 84 946 31 32 10 13 110 1234 45 41 15 15 135 1521 60 50 20 17 161 1826 75 59 25 17.5 187 2136 90 68 500 0 12 59.4 364 20 14 10 14 113 1275 46 43 15 16 138 1560 59 51 20 18 162 1823 74 59 25 19 187 2085 89 67 550 0 13 63.8 386 22 16 10 15 121 1359 48 46 15 17 145 1635 61 53 20 19 168 1892 75 62 25 21 194 2179 90 71 30 22 220 2455 104 80 600 0 13 68.1 406 24 17 10 16 129 1431 50 49 15 18 152 1710 63 55 20 20 174 1984 77 65 25 22 201 2262 91 75 30 23 228 2520 105 79 Table 3a. Daily nutrient requirements for dairy youngstock. (See "Tables for Hand Rations" on Left Sidebar of this website) Table 3b. 2001 NRC: Nutrient requirements for Friesian Dairy Heifers Mature weight: 650 kg, Age: 20 mo, BCS: 3.0, Days pregnant: 240 d, Conceptus weight: 48.1 kg BW ADG DMI ME CP Ca P kg kg/d kg Mcal/d % g/d g/d 450 0.5 (1.1) 10.5 22.5 12.9 47 25 (296) 0.6 (1.2) 10.5 23.2 13.3 50 25 0.7 (1.3) 10.5 23.9 13.7 53 26 0.8 (1.4) 10.5 24.5 14.2 55 27 0.9 (1.5) 10.4 25.2 14.7 58 28 1.0 (1.6) 10.4 25.8 15.1 61 29 1.1 (1.7) 10.3 26.4 15.6 63 30 500 0.5 (1.1) 11.3 24.2 12.5 49 26 (332) 0.6 (1.2) 11.4 25.0 12.9 52 27 0.7 (1.3) 11.4 25.7 13.3 54 27 0.8 (1.4) 11.3 26.4 13.7 57 28 0.9 (1.5) 11.3 27.2 14.1 59 29 1.0 (1.6) 11.2 27.8 14.5 62 30 1.1 (1.7) 11.1 28.5 15.0 65 31 550 0.5 (1.1) 12.2 25.9 12.1 51 27 (369) 0.6 (1.2) 12.2 26.7 12.5 53 28 0.7 (1.3) 12.2 27.5 12.9 56 29 0.8 (1.4) 12.2 28.3 13.3 58 29 0.9 (1.5) 12.1 29.1 13.7 61 30 1.0 (1.6) 12.1 29.8 14.1 64 31 1.1 (1.7) 12.0 30.5 14.5 66 32 600 0.5 (1.1) 13.0 27.5 11.8 53 28 (406) 0.6 (1.2) 13.0 28.4 12.2 55 29 0.7 (1.3) 13.0 29.3 12.5 58 30 0.8 (1.4) 13.0 30.1 12.9 60 30 0.9 (1.5) 13.0 30.9 13.3 63 31 1.0 (1.6) 12.9 31.7 13.7 65 32 1.1 (1.7) 12.8 32.5 14.1 68 33 650 0.5 (1.1) 13.8 29.1 11.6 54 29 (443) 0.6 (1.2) 13.8 30.1 12.0 57 30 0.7 (1.3) 13.8 31.0 12.3 59 31 0.8 (1.4) 13.8 31.9 12.7 62 31 0.9 (1.5) 13.8 32.7 13.0 64 32 1.0 (1.6) 13.7 33.6 13.4 67 33 1.1 (1.7) 13.6 34.4 13.8 69 34 700 0.5 (1.1) 14.6 30.7 11.4 56 30 (479) 0.6 (1.2) 14.6 31.7 11.8 59 31 0.7 (1.3) 14.6 32.7 12.1 61 32 0.8 (1.4) 14.6 33.6 12.4 63 32 0.9 (1.5) 14.6 34.5 12.8 66 33 1.0 (1.6) 14.5 35.4 13.2 68 34 1.1 (1.7) 14.4 36.3 13.5 71 35 Table 4. Requirements of minerals, trace-elements and main vitamins for different categories of cattle. (See "Tables for Hand Rations" on Left Sidebar of this website) Table 5. Quality of some commonly available roughages in Kenya (See "Tables for Hand Rations" on Left Sidebar of this website) Table 6. Quality of some commonly available concentrates and by-products in Kenya (See "Tables for Hand Rations" on Left Sidebar of this website) References: http://www.infonet-biovision.org/AnimalHealth/Animal-nutrition-and-feed-rations http://192.156.137.110/ssafeed/ |
|
||||||||||||||||||||||||||||||||||||||||||||||||||||||||||||||||||||||||||||||||||||||||||||||||||||||||||||||||||||||||||||||||||||||||||||||||||||||||||||||||||||||||||||||||||||||||||||||||||||||||||||||||||||||||||||||||||||||||||||||||||||||||||||||||||||||||||||||||||||||||||||||||||||||||||||||||||||||||||||||||||||||||||||||||||||||||||||||||||||||||||||||||||||||||||||||||||||||||||||||||||||||||||||||||||||||||||||||||||||||||||||||||||||||||||||||||||||||||||||||||||||||||||||||||||||||||||||||||||||||||||||||||||||||||||||||||||||||||||||||||||||||||||||||||||||||||||||||||||||||||||||||||||||||||||||||||||||||||||||||||||||||||||||||||||||||||||||||||||||||||||||||||||||||||||||||||||||||||||||||||||||||||||||||||||||||||||||||||||||||||||||||||||||||||||||||||||||||||||||||||||||||||||||||||||||||||||||||||||||||||||||||||||||||||||||||||||||||||||||||||||||||||||||||||||||||||||||||||||||||||||||||||||||||||||||||||||||||||||||||||||||||||||||||||||||||||||||||||||||||
